Which problem is still the Number One world worry? Is it the family? Is it the career, or the kids? No, it's money - or lack of it as the case may be. Wouldn't it be easier on your brain if you could forget all about your money problems; if you could be sure that you had enough to pay all the bills and still have enough spare cash left to drink the nights away? Well you can.. just by thinking ahead a little to produce your own budget; and with the spreadsheet technology at hand this has never been so easy!
One of the first areas you may wish to 'forecast' is your earnings/income. Then you can ensure you don't get ripped off by tax, poor wage calculations or typing errors, which all goes together in helping you achieve a greater peace of mind. As a simple example, take a look at my monthly earnings below:
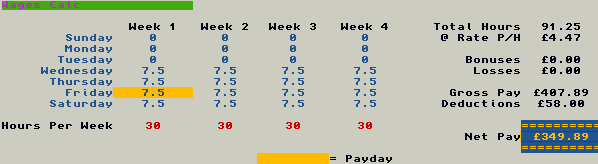
On the left we have space to calculate the exact number of hours you would work each week, with plenty of scope for adding overtime, additional days or sick-days. On the right we work out an approximate pay based on: the hours worked [x] rate of pay per hour [-] any taxes. This is a very simple method of wage calculation and only needs to show one wage error before you realise how valuable it really is. You may also wish to add your own method of calculating income tax to make this forecast more accurate.

Once you are confident with your take-home pay, we can use this figure to predict our outgoing for each month. This means we know exactly how much we have coming in, where the money goes, and how much we have left to splurge. An easy method is to list everything out on a single sheet to provide a general years overview; just like the example below:
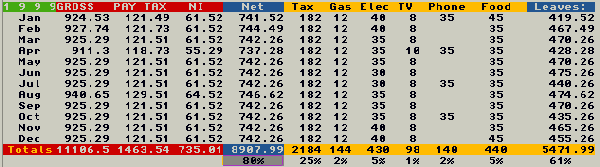
Here you can see we use columns to show individual figures, which makes things much easier to read. An advantage of this method is that you can easily spot the effect of changing any figures; and to see how this impacts on the whole year. This is also an easy way of working things out on paper if you don't have access to a spreadsheet. A disadvantage is that the sheet tends to become very wide as you add more and more columns to it.
If you are a little more sceptical at to the benefits of budgeting, why not try a few example monthly sheets, such as the example below.
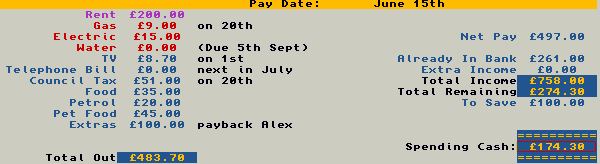
Now the figures a listed on rows instead of columns, which means we can add much more information to a single page. As you can see, on the left we can work out exactly what needs to be paid for each month, with plenty of room to add individual expenses to make the chart as details as you like. On the right, we add up our amount we can spend on these expenses; our previously worked out Net pay [+] any money we have in the bank [+] anything other money we are due. Then we can take away the expenses from this figure to give us the total remaining - which we can decide to save or spend as we wish. An advantage here is that we can see just where every penny goes each month, giving us even more confidence in our money. If you are a little more adventurous you can also 'chain' these months together in your spreadsheet, linking the 'money in bank' figure to the 'money to save' or 'spending money' of the previous month. The disadvantage is they it becomes much harder to navigate a long list of months to keep tack of changes; for example, how a change in Aprils figures would affect the holiday you are saving for in September.
Taking this a step further, you can even try to cut the price of, say your fuel bill or your shopping, by studying the prices you are actually paying. Why pay prices in excess when you can buy exactly the same cheaper somewhere else? Lets look at fuel costs as this is a little more complicated than simply comparing shopping receipts. In the following example, you can see that it can be quite easy to predict your miles per litre and the cost of each litre, just by updating your mileage and expenditure each week/month.
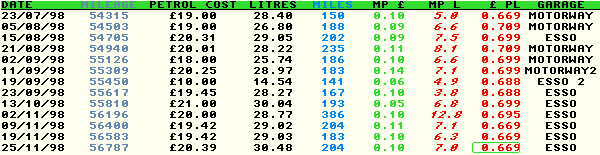
In this case, you would work out the miles travelled by taking that weeks mileage away from the previous weeks figure. Miles per (Ł) can be done by dividing the money you spent on fuel the week before, from the new 'miles travelled' figure. Miles Per Litre is; miles travelled [/] previous weeks litres bought, and Price per litre is; cost [/] litres bought. Now you can check just how much 'miles per Ł' you get from each filling station you visit. (Remember that some fuels will take your car further than other, cheaper, fuels).
What else can you do to remove your money worries? Sometimes it's easy to loose track of just who owes what to who, so its handy to jot down these figures as they come and go, even if it's just a case of 'who gets the next take-away?'. Saving for a holiday? Sometimes it can take years to get enough together for a really good time away, so in this case you may need to plan your earnings out well in advance, and then you know how much you can spend and still leave enough for what you need. Budget charts really come into their own in the event of a financial crisis; an accident in the car or at work; an unexpected pregnancy; a breakdown; hospital treatment or doctors bills etc. Now, instead of worrying about the times ahead, you can take a look at the figures and perhaps, with a few cuts here and there, you will come thought it ok.
Take away that load off your mind - plan ahead!
Related Links:-
If you would like to comment on this page or add information to it, click Here